Measuring Paid Advertising ROI: Essential Metrics to Track
Master ROI measurement for paid advertising campaigns. Learn which metrics matter, how to track conversions accurately, and how to prove the value of your ad spend.
Measuring Paid Advertising ROI: Essential Metrics to Track
"Half the money I spend on advertising is wasted; the trouble is I don't know which half." This famous quote shouldn't apply to modern digital advertising—yet many businesses still can't accurately measure their advertising ROI.
At Silver Spider Media, we obsess over measurement. Our clients know exactly which campaigns, platforms, keywords, and ads generate profitable returns. In this comprehensive guide, we'll show you how to measure paid advertising ROI accurately and use data to optimize performance.
Why ROI Measurement Matters
Beyond Vanity Metrics
Getting 10,000 impressions and 400 clicks sounds impressive—until you realize it generated zero customers and cost £600. Proper ROI measurement separates what feels good from what actually drives business results.
What Most Businesses Track (But Shouldn't Focus On):
- Impressions
- Clicks
- CTR (Click-Through Rate)
- CPC (Cost Per Click)
These are "vanity metrics"—they might indicate campaign health, but they don't directly correlate with profitability.
What Successful Businesses Track:
- Conversions (leads, sales, calls)
- Cost per conversion
- Conversion rate
- Customer acquisition cost
- Return on ad spend (ROAS)
- Customer lifetime value (CLV)
The Business Impact
Accurate ROI measurement allows you to:
- Identify Profitable Campaigns - Scale what works, pause what doesn't
- Optimize Budget Allocation - Put money where it delivers best returns
- Justify Ad Spend - Prove value to stakeholders/business partners
- Make Data-Driven Decisions - No more guessing, gut-feeling, or hope
- Calculate Growth Capacity - Know how much you can invest to achieve revenue goals
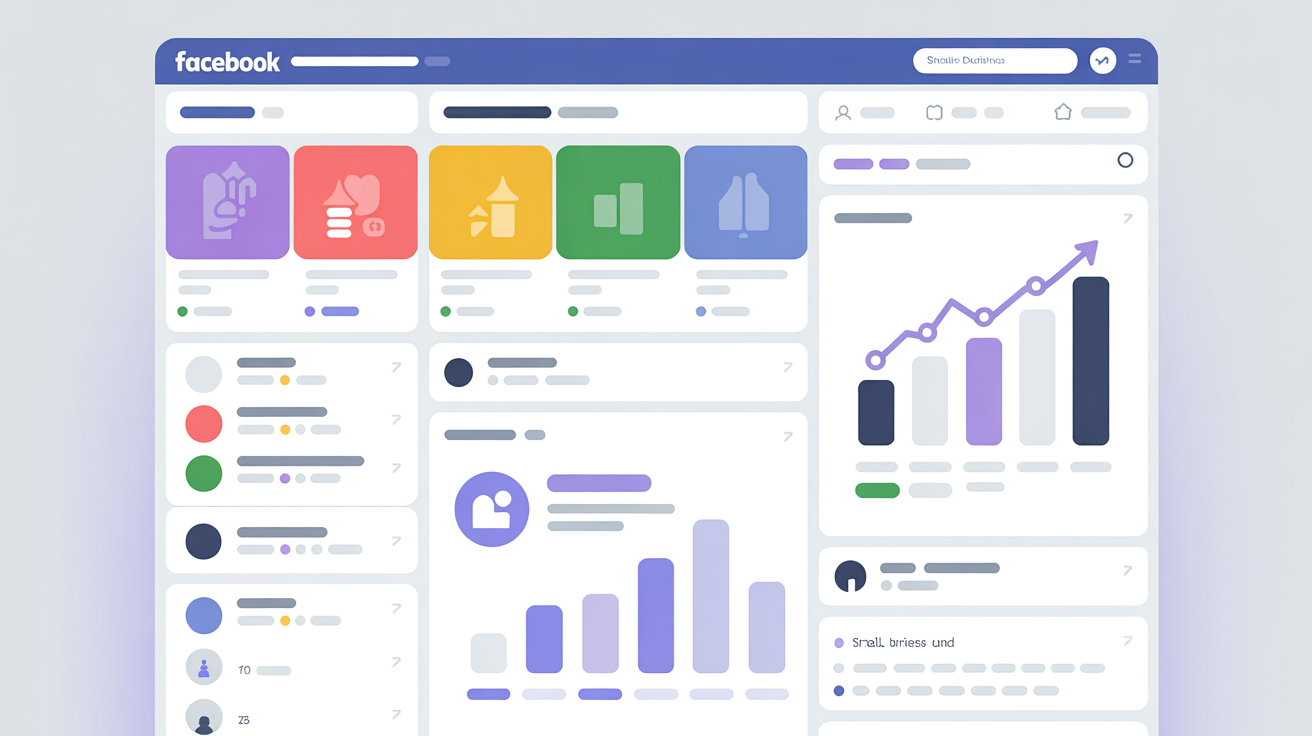
When we implemented comprehensive tracking for LA Engineering Northwest, they discovered their LinkedIn campaigns delivered 5.2x better ROI than Facebook despite costing 3x more per lead—LinkedIn leads converted to customers at 23% vs. Facebook's 7%. Without proper tracking, they'd been overinvesting in the wrong platform.
Essential Metrics Explained
Primary Metrics (Business Impact)
1. Conversions
The specific actions you want users to take:
- Form submissions
- Phone calls (over 60 seconds)
- Chat initiations
- Quote requests
- Purchases
- Appointment bookings
Why It Matters: Everything flows from conversions—they're the bridge between ad spend and revenue.
How to Track:
- Google Ads: Conversion tracking tags
- Facebook: Pixel events
- Phone Calls: Call tracking numbers
- Forms: Thank-you page tracking
2. Conversion Rate
Percentage of clicks that convert.
Formula: (Conversions ÷ Clicks) × 100
Example:
- 50 conversions from 500 clicks = 10% conversion rate
Industry Benchmarks:
- Cold traffic: 2-5% good, 5-10% excellent
- Warm traffic (remarketing): 10-20% good, 20%+ excellent
- Search ads: 5-15% typical
- Social ads: 2-8% typical
Why It Matters: Conversion rate determines how efficiently traffic converts—higher rates mean lower cost per conversion.
3. Cost Per Conversion (CPL - Cost Per Lead)
How much you pay for each conversion.
Formula: Total Ad Spend ÷ Conversions
Example:
- £1,000 spend, 40 conversions = £25 cost per conversion
What's "Good"? Depends entirely on your customer value:
- If average customer worth is £500, £25 per lead is excellent
- If average customer worth is £100, £25 per lead is terrible
Why It Matters: Directly determines profitability—this metric is critical for budget decisions.
4. Customer Acquisition Cost (CAC)
The complete cost to acquire a new customer (not just a lead).
Formula: Total Ad Spend ÷ New Customers
Example:
- £2,000 spend, 50 leads, 10 became customers
- CAC: £2,000 ÷ 10 = £200 per customer
Why It Matters: Ultimate profitability metric—compares directly to customer lifetime value to determine true ROI.
5. Return on Ad Spend (ROAS)
Revenue generated per pound spent on ads.
Formula: Revenue from Ads ÷ Ad Spend
Example:
- £2,000 ad spend generated £8,000 revenue
- ROAS: £8,000 ÷ £2,000 = 4:1 (or 400%)
For every £1 spent, you earned £4 back.
Minimum Benchmarks:
- Survival: 2:1 (breaking even after costs)
- Acceptable: 3:1
- Good: 4:1
- Excellent: 5:1+
Why It Matters: Clearest metric for profitability and scalability—shows if campaigns are worth continuing.
6. Customer Lifetime Value (CLV)
Total revenue a customer generates over their entire relationship with your business.
Formula: Average Transaction Value × Purchase Frequency × Customer Lifespan
Example - Accounting Firm:
- Annual fee: £1,200
- Average retention: 6 years
- CLV: £1,200 × 6 = £7,200
Example - Tradesperson:
- Average job: £800
- Jobs per year: 2
- Customer lifespan: 4 years
- CLV: £800 × 2 × 4 = £6,400
Why It Matters: Determines how much you can afford to spend on acquisition—if CLV is £7,200, you can afford higher CAC than if CLV is £400.
CLV to CAC Ratio: Healthy businesses maintain 3:1 ratio (CLV is 3x CAC)
- CLV: £6,000
- Maximum CAC: £2,000
- Target CAC: £1,000-£1,500
Secondary Metrics (Campaign Health)
7. Click-Through Rate (CTR)
Percentage of people who see your ad and click it.
Formula: (Clicks ÷ Impressions) × 100
Benchmarks:
- Google Search Ads: 3-8% typical, 8%+ excellent
- Google Display Ads: 0.5-1% typical, 1.5%+ excellent
- Facebook Ads: 1-3% typical, 3%+ excellent
- LinkedIn Ads: 0.4-0.8% typical, 1%+ excellent
Why It Matters: Indicates ad relevance—low CTR means ads aren't resonating, costing more per click.
8. Cost Per Click (CPC)
How much each click costs.
Formula: Total Ad Spend ÷ Clicks
Industry Ranges (UK):
- Legal services: £5-£15
- Accounting: £3-£8
- Construction: £2-£6
- Landscaping: £1-£4
- Local services: £0.80-£3
Why It Matters: Efficiency metric—combined with conversion rate, determines cost per conversion.
9. Quality Score (Google Ads)
Google's assessment of ad relevance (1-10 scale).
Components:
- Expected CTR
- Ad relevance
- Landing page experience
Why It Matters: Higher Quality Scores = lower CPCs and better ad positions. Improving from 4 to 8 can reduce CPC by 30-50%.
10. Impression Share
Percentage of possible impressions your ads received.
Formula: Your Impressions ÷ Total Available Impressions
Example:
- 70% impression share = Your ads showed for 70% of searches, missed 30%
Why It Matters: Shows if you're missing opportunities due to budget or rank limitations.
Setting Up Proper Tracking
Google Ads Conversion Tracking
Step 1: Define Conversions
Identify all valuable actions:
- Form submissions (contact, quote request)
- Phone calls (over 60 seconds)
- Live chat starts
- Downloads (guides, resources)
- Specific page visits (thank you, pricing viewed)
Step 2: Implement Tracking Tags
Website Actions:
- Install Global Site Tag on all pages
- Add conversion-specific tags on thank-you pages
- Test using Google Tag Assistant
Phone Calls:
- Google forwarding numbers (free, easiest)
- Third-party call tracking (more detailed)
- Track calls from ads, calls from website separately
Step 3: Assign Conversion Values
If average customer worth is £600 and 30% of leads convert:
- Lead value: £180
- Assign this value to each conversion
This enables value-based bidding for maximum revenue.
Facebook Pixel Tracking
Step 1: Install Facebook Pixel
Add Pixel code to all website pages—base code tracks page views and builds remarketing audiences.
Step 2: Configure Standard Events
Essential Events:
- PageView (automatic with base code)
- Lead (form submission)
- Contact (contact form, phone click)
- CompleteRegistration (account creation)
- ViewContent (key pages viewed)
Step 3: Test Pixel
Use Facebook Pixel Helper browser extension to verify events firing correctly.
Step 4: Verify Events
Facebook Events Manager shows events received—check 24-48 hours after installation.
Call Tracking Implementation
Phone calls are typically 30-60% of conversions for local businesses—missing call tracking means missing 30-60% of your ROI picture.
Options:
1. Google Call Forwarding (Free)
- Google-provided numbers
- Tracks calls from ads
- Basic reporting
2. Dynamic Number Insertion (Advanced)
- Different numbers by traffic source
- Tracks calls from all marketing
- Detailed call recording/analytics
- Costs: £50-£200/month
Popular Services: CallRail, CallTrackingMetrics, ResponseTap
For Bourne Accounting, implementing call tracking revealed that 62% of conversions came via phone, not forms. Without call tracking, they were only seeing 38% of their results—dramatically underestimating campaign ROI.
Attribution Models
Understanding Customer Journeys
Customers rarely convert on first click. Typical journey:
Day 1: See Facebook ad, visit website, leave Day 5: Search your business name, visit again, leave Day 8: Google your service + location, click ad, see remarketing ad, return, convert
Which campaign deserves credit for the conversion?
Attribution Models Explained
Last Click Attribution (Default) Conversion credit goes to the last touchpoint (the Google ad in our example).
Pros: Simple, clear Cons: Ignores all earlier touchpoints that influenced the decision
First Click Attribution Credit goes to first touchpoint (the Facebook ad).
Pros: Values top-of-funnel awareness Cons: Ignores nurturing that led to conversion
Linear Attribution Equal credit to all touchpoints.
Pros: Acknowledges full journey Cons: Doesn't differentiate touchpoint importance
Time Decay Attribution More credit to touchpoints closer to conversion.
Pros: Rewards final touches whilst acknowledging earlier ones Cons: May undervalue awareness campaigns
Data-Driven Attribution (Google Ads, requires sufficient data) Machine learning assigns credit based on actual contribution.
Pros: Most accurate Cons: Requires 15,000+ clicks and 600+ conversions
Recommended Approach
For Most Businesses: Use last-click initially (simplest), graduate to data-driven once you have sufficient conversion volume.
For Multi-Channel Strategies: Review multi-channel funnel reports monthly to understand how channels work together—don't judge each in isolation.
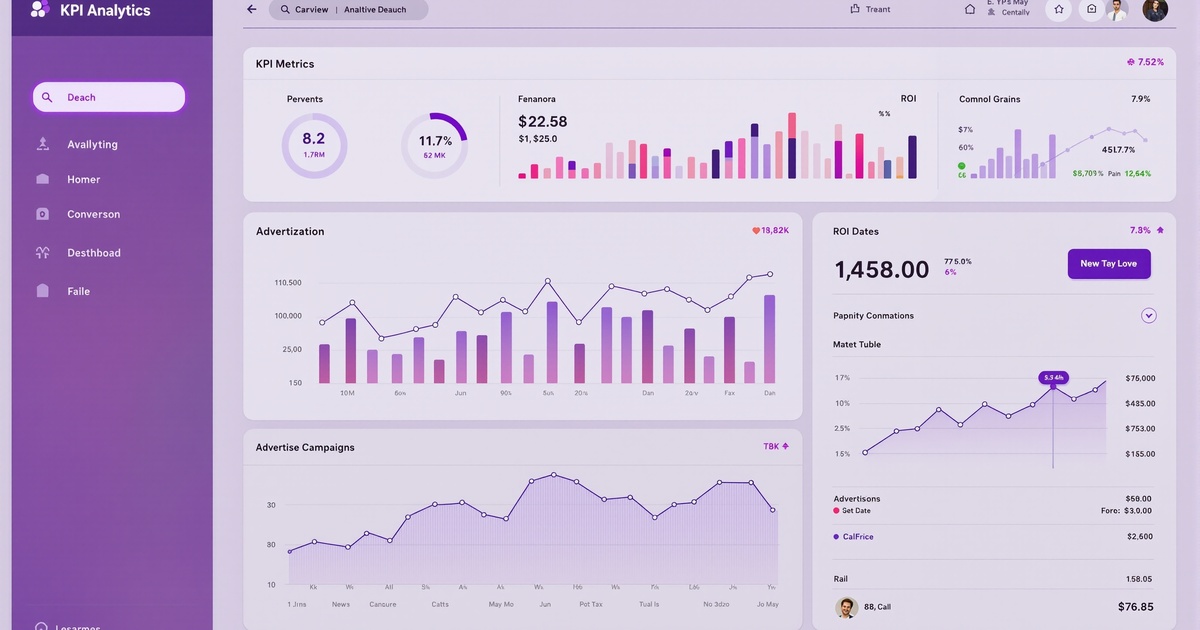
Creating Your ROI Dashboard
Essential Monthly Report
Track these metrics monthly minimum:
Campaign Performance:
- Total Ad Spend (by platform)
- Total Conversions (by platform and campaign)
- Cost Per Conversion (by campaign)
- Conversion Rate (by campaign)
Business Impact: 5. New Customers Acquired 6. Customer Acquisition Cost 7. Revenue Generated 8. Return on Ad Spend (ROAS)
Efficiency Metrics: 9. CTR (by platform) 10. CPC (by platform) 11. Quality Score (Google Ads)
Example Dashboard: Local Service Business
Month: January 2026
Google Ads:
- Spend: £1,200
- Conversions: 48 leads
- CPL: £25
- Conversion Rate: 8.2%
- Customers: 12 (25% lead-to-customer rate)
- CAC: £100
- Revenue: £7,200
- ROAS: 6:1
- Spend: £600
- Conversions: 42 leads
- CPL: £14.29
- Conversion Rate: 6.1%
- Customers: 6 (14% lead-to-customer rate)
- CAC: £100
- Revenue: £3,600
- ROAS: 6:1
Remarketing:
- Spend: £300
- Conversions: 18 leads
- CPL: £16.67
- Conversion Rate: 14.3%
- Customers: 5 (28% lead-to-customer rate)
- CAC: £60
- Revenue: £3,000
- ROAS: 10:1
Total:
- Spend: £2,100
- Conversions: 108 leads
- Customers: 23
- Revenue: £13,800
- ROAS: 6.6:1
Insight: Remarketing delivers best ROI (10:1) at lowest CAC (£60)—opportunity to invest more here. Facebook generates cheaper leads than Google but lower quality (14% vs. 25% conversion rate)—focus on lead quality improvement.
Optimization Based on Data
Weekly Review Process
Monday Morning (15 minutes):
-
Check Weekend Performance Was weekend spend on pace? Any surprises?
-
Review Conversion Data How many leads/sales over weekend?
-
Search Term Report (Google Ads) Add 5-10 new negative keywords from irrelevant searches.
-
Quick Scan of Campaigns Any campaigns dramatically over/under-performing?
-
Quick Action Pause anything wasting money, increase budget on obvious winners.
Monthly Optimization Process
First Week of Month (2-3 hours):
-
Comprehensive Performance Analysis Review all campaigns vs. targets—which met goals, which didn't?
-
Budget Reallocation Shift budget from poor performers to top performers.
-
Ad Refresh Pause weakest-performing ads, introduce new variations.
-
Landing Page Review Check conversion rates by landing page—test improvements for weakest performers.
-
Audience Analysis Which demographics, locations, devices performing best? Adjust bids.
-
Competitor Review Check what competitors are doing—any new messaging or offers to counter?
-
Plan Next Month Set goals and priorities based on previous month data.
Quarterly Strategic Review
Quarterly (4-6 hours):
-
Big Picture Analysis Are we hitting business goals? Is ROI acceptable?
-
Customer Journey Analysis Review multi-channel funnels—how do channels work together?
-
CLV Analysis Calculate customer lifetime value from ad-acquired customers—is CAC sustainable?
-
Competitive Landscape Deep dive into what competitors are doing—market positioning still strong?
-
New Opportunities Should we test new platforms, audiences, or strategies?
-
Budget Planning Should overall budget increase, decrease, or stay the same?
Advanced ROI Measurement
Lead Quality Scoring
Not all leads are equal—develop lead quality score:
High-Quality Lead (Score: 10):
- Right location
- Right budget
- Right timeline
- Clear need
- Decision-maker
Medium-Quality Lead (Score: 5):
- Some qualifying criteria met
- Possibly converts with nurturing
Low-Quality Lead (Score: 1):
- Outside service area
- No budget
- No clear need
- Information-seeking only
Track Lead Quality by Campaign: If Campaign A costs £30 per lead with average quality 8 vs. Campaign B at £15 per lead with average quality 3, Campaign A is better value.
Multi-Touch Revenue Attribution
Track revenue back to original acquisition source:
Example: Customer acquired via Google Ads in January:
- Initial project: £2,000
- Follow-up project (March): £1,500
- Annual maintenance (Year 2): £800
Total Customer Value: £4,300
This customer's full value should be attributed to January's Google Ads campaign for true ROI calculation.
When Eden Gardens NI implemented lifetime value tracking, they discovered their Google Ads customers averaged £6,200 lifetime value vs. Facebook's £3,100—justifying significantly higher Google Ads spending despite higher initial CPL.
Common Measurement Mistakes
1. Tracking Clicks Instead of Conversions
Problem: "We got 500 clicks this month—that's great!" Reality: Clicks mean nothing without conversions Fix: Focus exclusively on conversion metrics
2. Not Tracking Phone Calls
Problem: Only tracking form fills, missing 40-60% of conversions Reality: Many customers prefer calling Fix: Implement call tracking immediately
3. Judging Too Quickly
Problem: Making dramatic changes after 3 days Reality: Need 50-100 conversions for statistical significance Fix: Wait 2-4 weeks before major decisions
4. Ignoring Lead Quality
Problem: Celebrating 100 leads/month when only 5 become customers Reality: Low-quality leads waste sales time Fix: Track lead-to-customer rate, optimize for quality not just quantity
5. Forgetting Customer Lifetime Value
Problem: Judging campaigns on immediate revenue only Reality: Customers continue buying for years Fix: Calculate and track CLV, attribute to acquisition source
Tools for ROI Tracking
Essential Tools:
Google Analytics 4:
- Free, comprehensive website analytics
- Multi-channel funnel reporting
- Custom conversion tracking
- Essential for all businesses
Google Ads:
- Built-in conversion tracking
- ROI reporting
- Attribution models
Facebook Ads Manager:
- Conversion tracking via Pixel
- Custom reporting
- Attribution windows
Call Tracking:
- CallRail (£30-£200/month)
- CallTrackingMetrics (£30-£180/month)
- ResponseTap (£50-£300/month)
CRM Integration:
- HubSpot (tracks lead-to-customer journey)
- Salesforce (comprehensive attribution)
- Pipedrive (affordable for small business)
Spreadsheet Dashboards: For businesses under £5K/month ad spend, a well-built spreadsheet dashboard combining data from platforms is often sufficient.
Get Professional Help
Accurate ROI measurement and optimization requires expertise in analytics setup, data interpretation, and continuous testing. Professional management typically delivers 2-3x better ROI through sophisticated tracking and data-driven optimization.
At Silver Spider Media, we implement comprehensive tracking systems and provide transparent ROI reporting. Our clients know exactly what they're getting for every pound spent—and how to improve it.
Our services include:
- Complete tracking setup (conversions, calls, CRM)
- Custom ROI dashboards
- Weekly monitoring and optimization
- Monthly detailed reporting
- Strategic recommendations based on data
Explore our paid advertising services or request a custom proposal.
Not sure if your campaigns are profitable? Request a free ROI audit and we'll analyze your tracking setup and identify improvement opportunities.
Ready to Transform Your Business?
Join hundreds of successful businesses across the UK & Ireland who trust Silver Spider Media for their digital presence. Get your personalised quote today.
Our Web Design Services
Discover how we can help transform your online presence with our comprehensive digital solutions:
See These Strategies in Action
Check out how we've implemented these web design principles for real businesses:
Real results from our portfolio
Real results from our portfolio
Real results from our portfolio
Real results from our portfolio
Ready to Transform Your Online Presence?
Get a free, personalised quote in just 5 minutes. See exactly what your website will cost—no obligation, no surprises.